A VTS Data analysis of April 2025 commercial office space requirements reveals a significant market contraction potentially linked to recent swings in global economic policy changes. The data shows a broad-based slowdown across major markets following the major April 2nd tariff policy implementation, known as “Liberation Day”, raising questions about the potential duration and depth of this market shift.
Market Contraction Overview
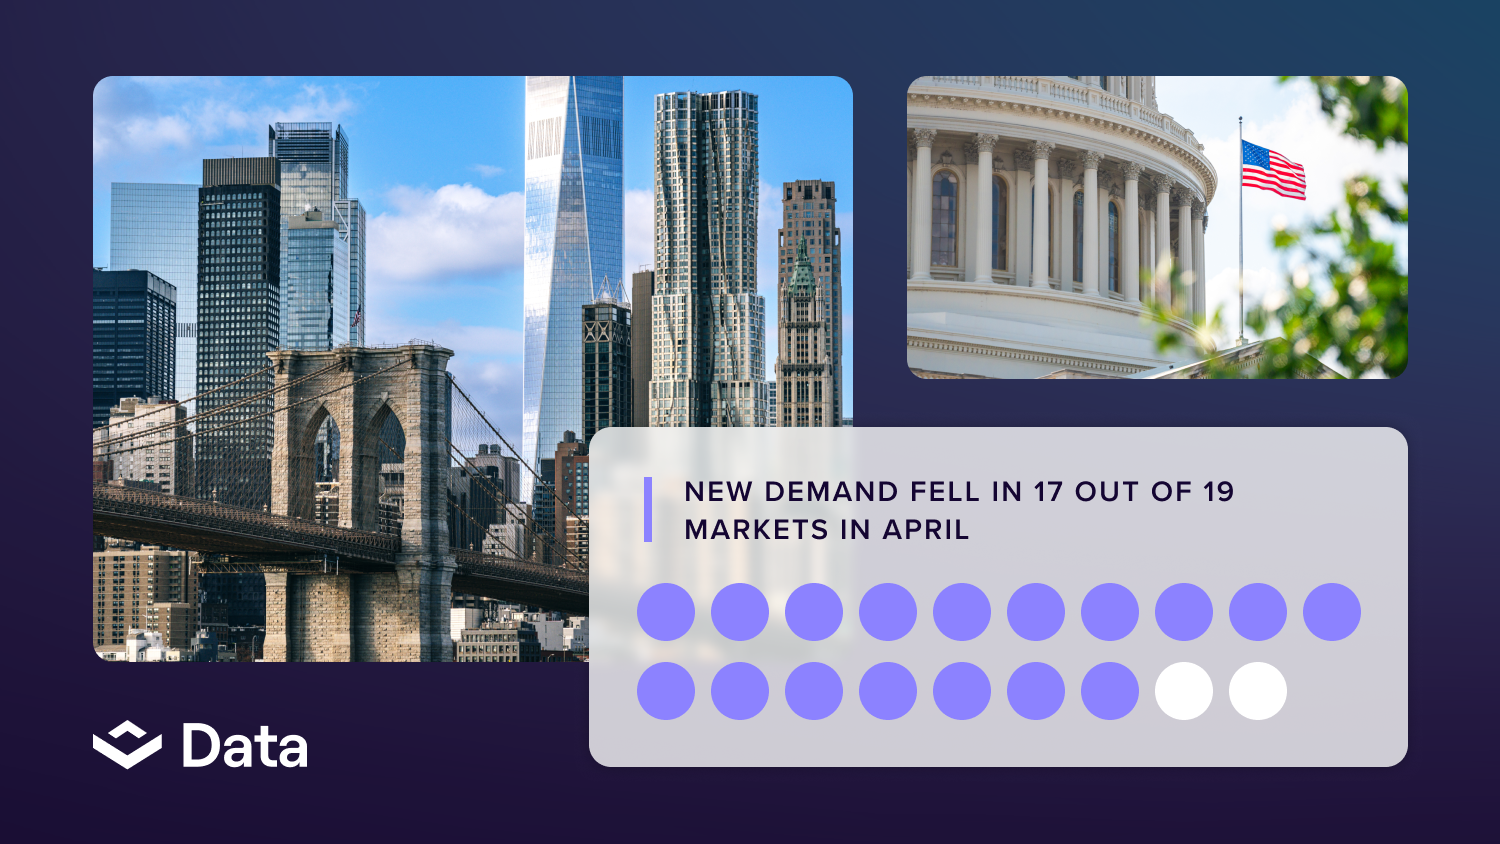
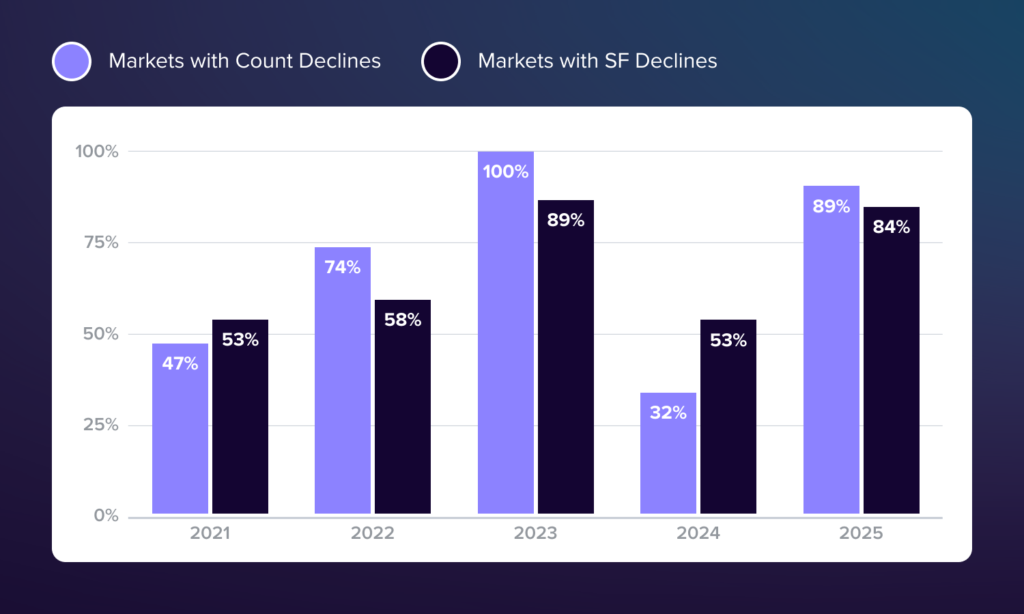
The April 2025 data indicates a widespread decline in tenant demand, with 17 of 19 markets experiencing decreases in requirement velocity by count compared to March 2025. This exceeds the prevalence of declines observed in three of four comparable March-April transitions since 2021. Similarly, 16 of 19 markets showed declines in requirement velocity by square footage, also surpassing historical norms for this time period.
In absolute terms, total requirement count decreased 23.2% month-over-month, while total square footage fell 26.4%. These declines represent meaningful contractions in forward-looking leasing activity that warrant investor attention, particularly given their correlation with the timing of recent policy changes.
Historical Context: 2023 Banking Crisis Parallel and Recovery Pattern
The current downturn bears striking similarity to the March-April 2023 contraction, which coincided with the banking crisis of Silicon Valley Bank, Signature Bank, and later First Republic Bank failing in rapid succession. That crisis produced a comparable market response, with requirements declining 25.1% and square footage dropping 38.2% from March to April 2023. Every office market tracked experienced count declines during that period, with 17 of 19 markets showing square footage reductions.

What can the aftermath of the 2023 crisis tell us about potential recovery patterns? Following the April 2023 low point, the market immediately bounced back. Requirements rebounded 23% from April to May 2023, while square footage surged 54.3% in the same period, suggesting an initial market correction after the shock. However, market demand once again stumbled short term, with requirements declining 9.7% and square footage falling 11.0% from May to June 2023.

Specific markets showed varied recovery trajectories in the months following April 2023. New York saw requirements increase 25.4% and square footage surge 175.3% from April to May. Boston experienced a 45.9% rise in requirements from April to May, followed by continued square footage expansion through June. San Francisco demonstrated resilience with a 39.3% requirements increase and 67.6% square footage growth from April to May.
March-April Transition Analysis (2021-2025)
Looking at the five-year trend of March-April transitions provides important context for understanding the current market shift. The pattern shows considerable variation: 2021 saw marginal growth (+0.7% requirements, +4.7% square footage), followed by moderate declines in 2022 (-18.2% requirements, -8.9% square footage). The banking crisis in 2023 produced the sharpest contraction (-25.1% requirements, -38.2% square footage), while 2024 brought modest growth in requirements (+3.4%) with minimally reduced square footage (-0.7%)
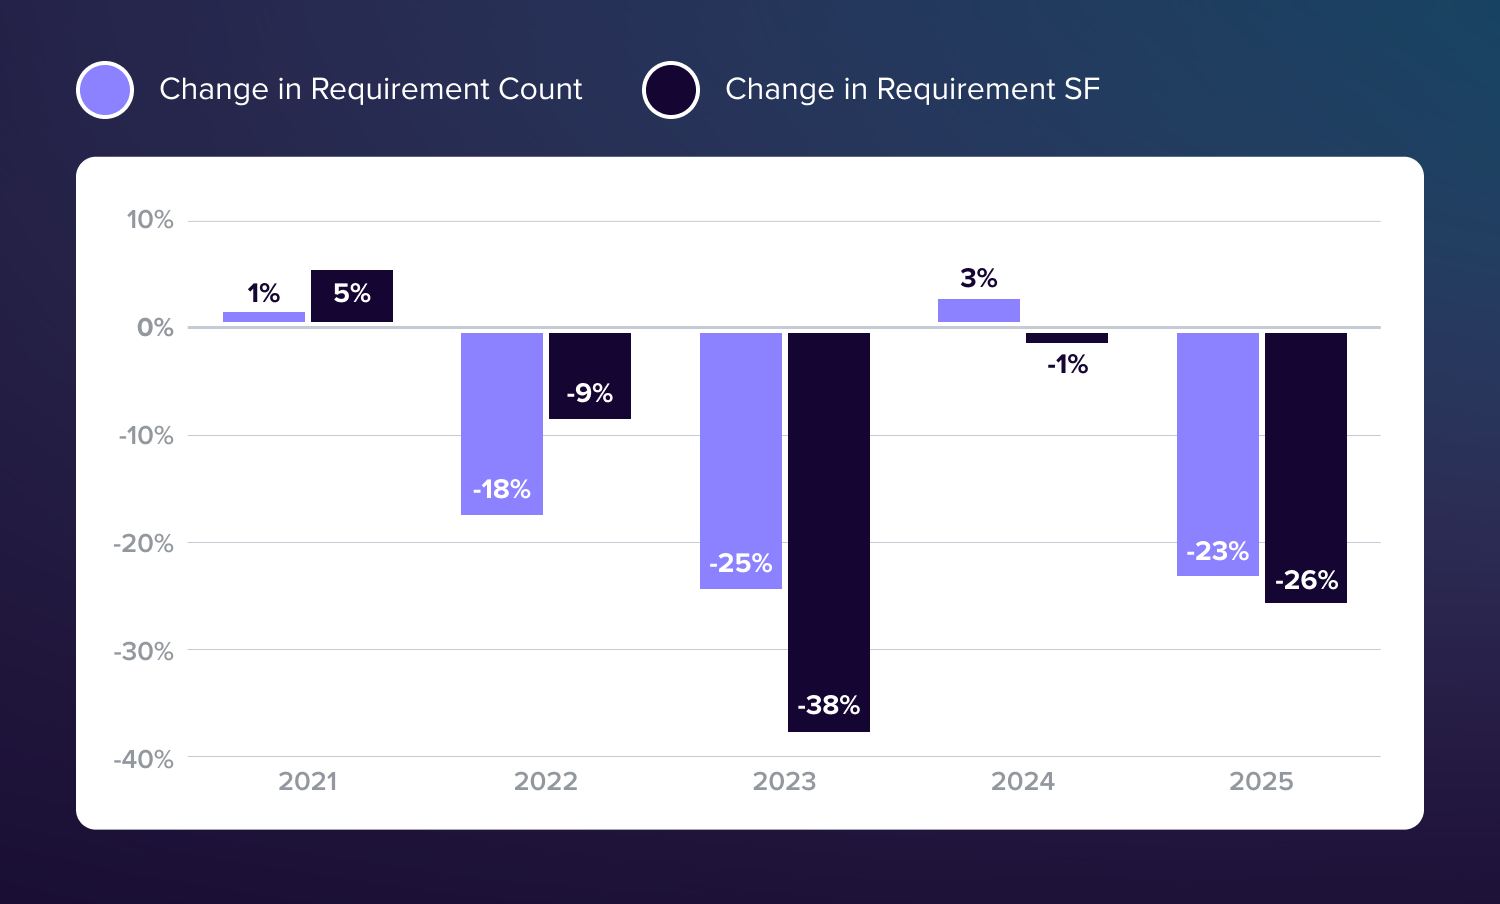
The 2025 data (-23.2% requirements, -26.4% square footage) represents the second most severe March-April decline in the five-year period, exceeded only by the 2023 banking crisis. This positioning suggests the current market response to tariff policy implementation is comparable in magnitude to the significant financial system shock we witnessed in Spring 2023.
Market Performance Analysis
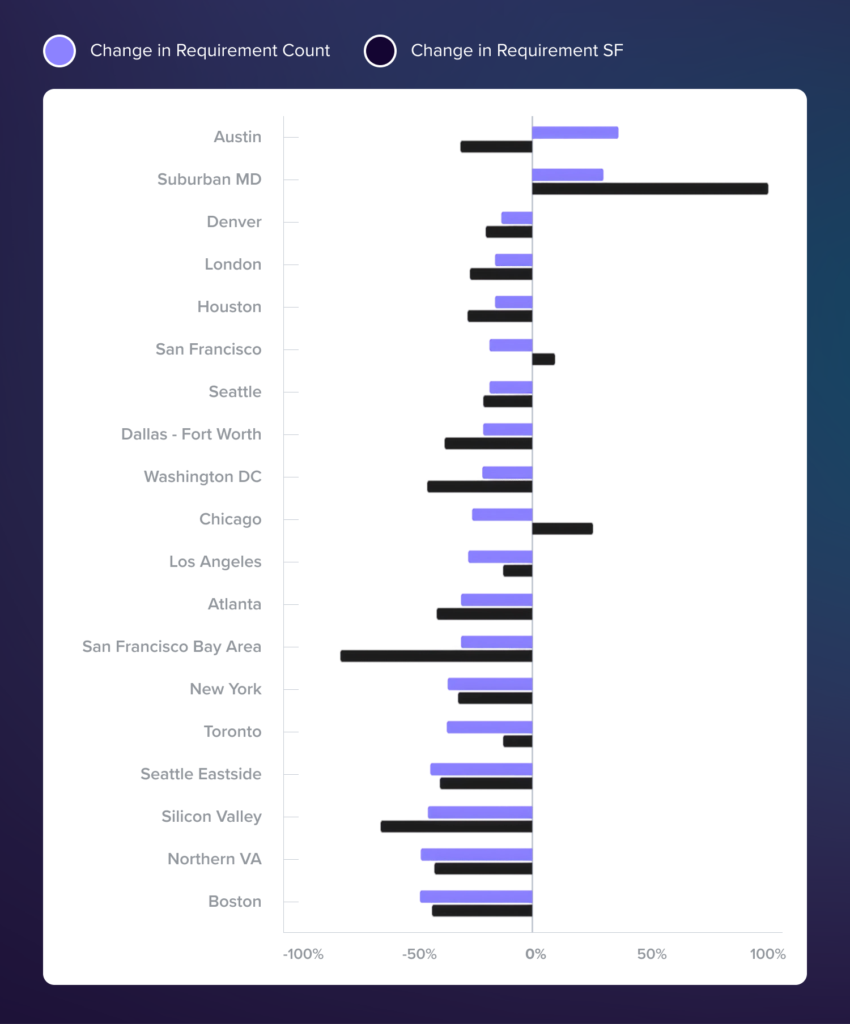
Analyzing the current situation at a market-level reveals meaningful variations in performance. The hardest-hit markets by tenant count include Boston (-44.1%), Northern Virginia (-43.6%), and Silicon Valley (-40.9%). By contrast, Suburban Maryland (+28.0%) and Austin (+34.0%) demonstrated resilience.
Several markets showed mixed signals. Chicago experienced a 23.6% decline in requirement count but a 23.8% increase in square footage. Similarly, San Francisco saw a 16.7% reduction in count coupled with a 9.1% increase in square footage, suggesting fewer but larger transactions.
Visit: The Real Estate AI Revolution
Forward Outlook
If the current tariff-induced contraction follows a pattern similar to the 2023 banking crisis, we may see a significant recovery to follow. Historical precedent suggests we could experience a strong initial rebound, particularly in May, followed by marginally lower levels of activity short term.
For investors and industry stakeholders, this analysis suggests maintaining a measured approach. The correlation between policy timing and market response warrants attention, but our singular historical comparison suggests a strong and immediate rebound is possible following a systemic shock. Of course, the current administration's tariff policy is proving to be incredibly fluid, with changes and pauses to implementation occurring rapidly, and it remains to be seen what result the final state will be, which ultimately will determine where office demand moves directionally and how much of an impact we will witness in the market.
For additional public VTS Data insights, visit our April 2025 VODI Report
To unlock additional VTS Data insights for your business, contact our Head of Research: maximilian.saia@vts.com
Data source: VTS requirement velocity data across 19 major markets through April 2025