Executive Summary
- At mid-year, San Francisco is outperforming VTS's January forecast, New York remains largely on track and London has softened.
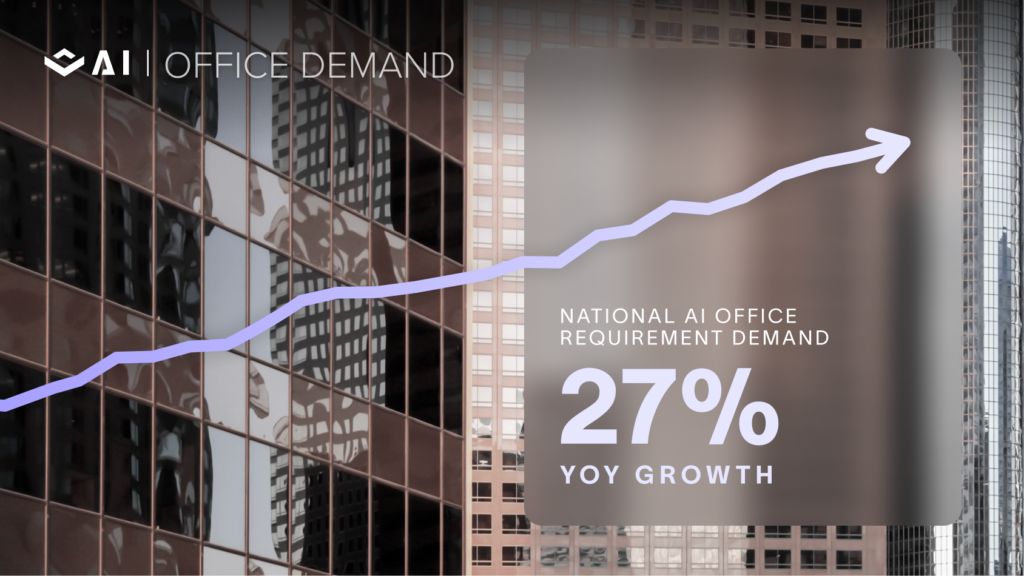
- San Francisco's 2026 leasing forecast has been revised upward 13% to 14.5 million square feet as AI-driven demand continues to convert into signed leases.
- New York's forecast rises 2% to 40.5 million square feet, while London's falls 9% to 9.3 million square feet.
- AI demand remains a major source of leasing momentum, but its concentration among a relatively small group of tenants also represents the greatest downside risk to the second-half outlook.
In January, VTS published our third annual Leasing Prediction Outlook, forecasting full-year 2026 leasing volume in San Francisco, New York and London using VTS office demand data, the earliest leading indicator of office leasing available. VTS predicted that San Francisco leasing would reach 12.8 million square feet, up 15% vs. 2025, New York leasing would increase 6% and achieve 39.8 million square feet, and London would lease 10.2 million square feet, an 8% improvement.
Halfway through 2026, actual leasing remains closely aligned with the signals captured in VTS demand data. San Francisco is running ahead of the number we published, though almost exactly in line with the number our model produced before we adjusted it for AI-concentration risk. New York and London have both tracked close, and we are moving their forecasts up 2% and down 9%, respectively. The rest of this update covers how each market got here, and what could cause these markets to diverge from our forecast in the second half of the year.
What VTS published in January
The three markets came into 2026 from very different places. San Francisco had just grown leasing 59% in a single year, New York had posted its strongest volume since 2019, and London was arriving off two consecutive annual declines, so the numbers below implied three different things about momentum.

Forecast Performance
The useful test at mid-year is what share of the full-year forecast is already booked. Nearly 50% by the end of June means the market is running exactly to forecast.

New York finished the first half at 48% of its full-year number. Although that pace is just below half of the January forecast, New York historically records slightly stronger leasing activity in the second half of the year. Updated demand inputs and the market's historical seasonality now point to a full-year total of 40.5 million square feet, a 2% increase from our January forecast. London finished the first six months at 46%, and because of this slower pace of leasing and decline in active demand, we have revised our full-year forecast downward 9%.Lastly, San Francisco, which finished above the pace expected by June, sits at 57%, but that comes with some caveats.
The San Francisco Update
San Francisco is the one market where we applied a risk adjustment on top of the model in January. AI tenant demand was the primary growth driver, and the market's forecast was risk-adjusted due to this single-sector exposure. This translated to an approximately 12% reduction in forecast leasing volume versus the unadjusted forecast.

The adjustment moved the January full year forecast down by 1.8 million square feet to 12.8 million square feet total. Rebuilding the year off six months of executed leasing puts San Francisco at a 14.5 million square foot pace for the year, and the original unadjusted model output in January was 14.6 million, only half a percent apart.
AI demand has continued unabated. Demand rose through the half rather than tapering, and it converted into signed leases instead of stalling in the pipeline. To account for continued concentration risk, we have retained the 12% adjustment in the revised forecast and applied it only to the unrealized second half. This yields a revised full-year forecast of 14.5 million square feet.
Revised Full-Year Forecasts

New York moves up 2%. In a market transacting close to 40 million square feet annually, a revision that small at the halfway point reinforces the accuracy of the January forecast. San Francisco moves up 13% and London moves down 9%, for opposite reasons: San Francisco because the demand was there, London because YTD active demand has come in slightly softer than expected, as has actual leasing in the first half of the year.
Final Thoughts
With half the year in the books, our range of uncertainty for the second half is narrower than it was at the start of the year. That doesn’t mean an individual market can’t take an unexpected turn, and the risk of that occurrence is not equal across the three markets.
San Francisco still carries the most risk. Its growth comes from a narrow set of AI tenants, and those firms lease on the strength of a funding cycle that has been both historically large and highly concentrated, with a small number of companies accounting for most of the capital and most of the square footage. If that funding slows in the second half, San Francisco could come in below what we have modeled. The 12% adjustment we still carry is meant to absorb some of that.
Although less concentrated, New York is more exposed to AI-demand dynamics than its steady headline suggests. Technology demand in New York is up 40% year over year while financial services demand is down 28%, so the market is holding its level by trading one tenant base for another. A pullback in technology leasing is therefore less likely to be offset by financial services than it may have been previously. London has a more balanced outlook. Our forecast came down due to demand running slightly cooler than expected, and our model forecasts a relatively similar second half of the year. A re-acceleration of any kind back to the trend initially anticipated would likely cause full-year leasing to come in ahead of our current forecast of 9.3 million square feet.
Methodology
The Leasing Prediction Outlook is built on VTS office demand data, the industry's earliest leading indicator of office leasing. It registers active tenant demand and registered space requirements six to twelve months before those deals appear in signed-lease statistics. We model that demand against three years of leasing actuals in each market to produce a single full-year forecast.
At mid-year we replace the modeled first half with what the market actually leased. Full-year 2026 is H1 leasing plus a modeled H2, scaled by each market's own H2 to H1 seasonality. San Francisco carries a 12% AI-concentration adjustment, applied only to the unrealized second half. Leasing actuals are blended from publicly reported brokerage data.