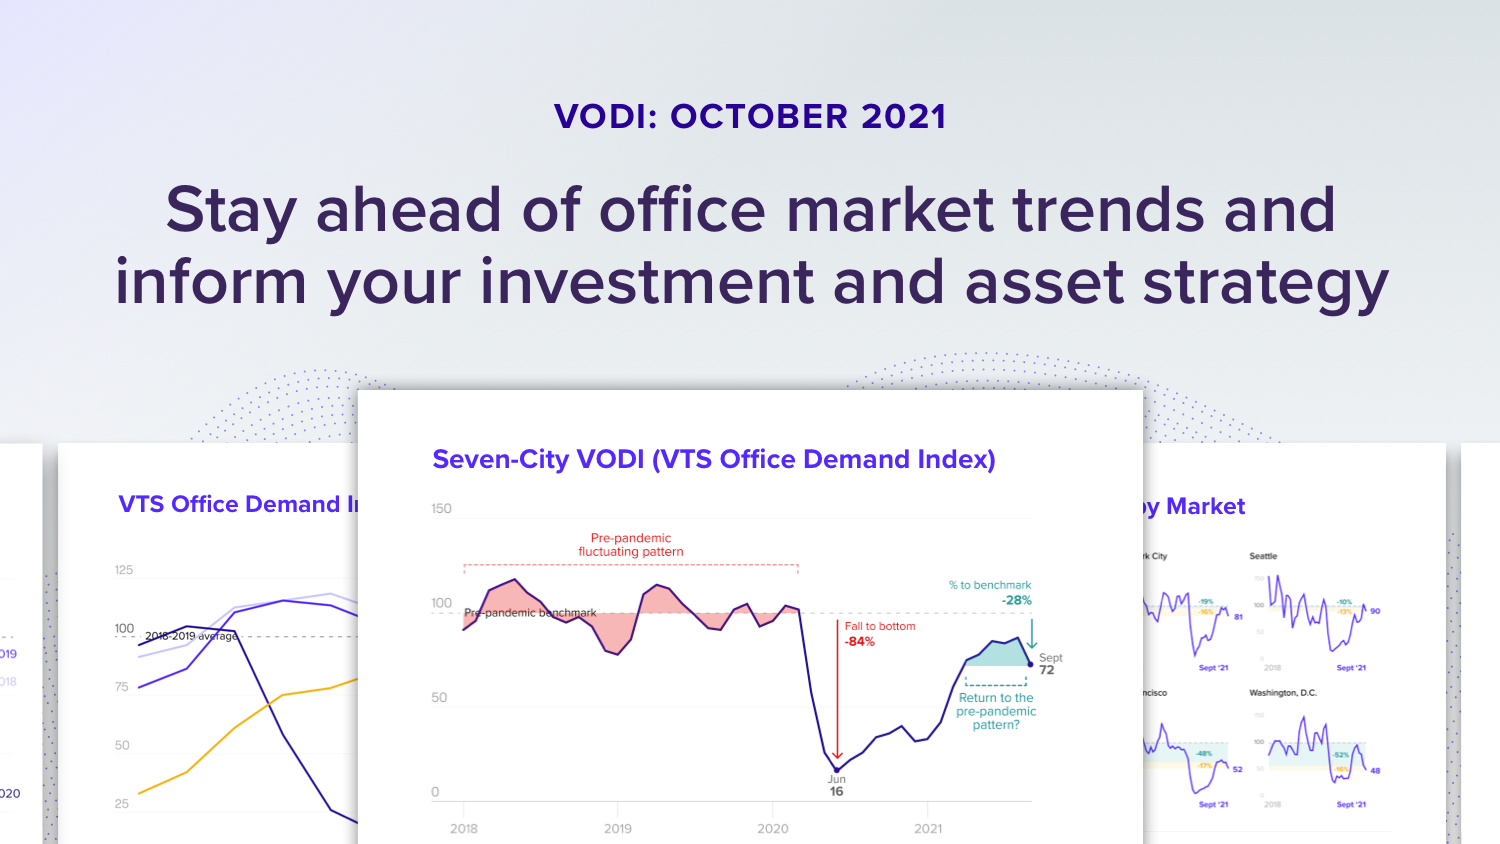
After a prolonged 9-month surge in demand for office space in 2021 that defied typical seasonal patterns, new demand receded significantly in September. Down 17% from August to September, the national VTS Office Demand Index (VODI) is now 28% lower than it was, on average, in the years leading up to the pandemic.
Likely factors that could explain the decline in new demand for office space include delta variant concerns and a delayed impact of resurging COVID-19 infection rates, typical seasonality, (though the pullback is more significant than in years past), and a surge of employers collectively shifting their entry into the market sooner, inflating demand for office space in the spring and summer of 2021 at the expense of the fall.
What is the VTS Office Demand Index (VODI)?
The VODI is the earliest available indicator of forthcoming office real estate trends, locally and nationally, and represents up to 99% of new demand for office space in seven major markets, including New York City, Washington DC, Los Angeles, Chicago, Boston, Seattle, and San Francisco. The VODI tracks tenant tours, both in-person and virtual, of office properties across the nation, and is the only commercial real estate index to track tenant demand.
The VTS Office Demand Index is powered by proprietary VTS Data, composed of aggregated and anonymized commercial real estate data from the 12B+ square feet of assets managed on the VTS platform.
Get today’s commercial real estate market trends in the October VODI report:
- How is the Delta variant impacting return-to-office plans in major cities?
- What does office demand look like in remote-friendly markets?
- Which market experienced a considerable decline in demand last month?
- Where is Trophy and Class A office space getting more popular?
- Which market experienced another month of continued stalled demand?
Download the full VTS Office Demand Index October 2021 report now for in-depth insights into demand recovery and detailed methodology.
Want more? The VTS Office Demand Index is just a sliver of the insights available in VTS Data. VTS Data is the industry's only forward-looking market data powered by the $200B in leasing transactions managed on the VTS platform. Our latest infographic — From Positioning to Pricing: Repositioning a Vacancy — shows just one of the many ways you can put this market data to work.
You can read our official announcement here.


