State of the CHI Office Market: Are the Winds in the Windy City Changing?
In every recession, new trends are born, some continue unabated, and for others, the bell will toll. And despite the unique nature of the public health crisis we’re currently recovering from, this recession has been no different in the Chicago market.
The metro, like the nation and many of the major gateway markets, saw the COVID-19 pandemic quickly ravage its economy — and likewise its office fundamentals. This called into question the future of urban office markets, like Chicago, as major employment hubs if people could now not only work-from-home but also work-from-anywhere.
But while these new trends emerged, and others continued unabated like Chicago’s property tax woes, the role of Chicago’s office market as a key part of its economy needs no questioning. I will explain below why traditional indicators used to analyze the office sector are not as robust when uncertainty remains high — and why VTS Data provides the real-time data set the office sector needs today and going forward.
Where Chicago office demand sits today, according to lagging indicators
It’s important to set the stage for where the Chicago office market is today. Most stakeholders in the commercial real estate office space focus on two factors to assess the current health of the office market: net absorption and vacancy. Okay, it's really three factors as rents are also important, but rents are a function of net absorption and vacancy.
As of Q1 2021, according to most CRE data sources, Chicago has seen aggregate net absorption of nearly negative 3 million square feet since Q1 2020 and vacancy rates close to 20% — an environment that hasn’t been seen since the financial crisis of 2008. However, these indicators can paint a flawed picture as they’re released quarterly and are based on information that largely went into motion (outside of the public view) several months and even quarters ago. This creates a tremendous amount of lag, which can misperceive reality and, for office investors, misperceive risk.
To counterbalance the lag in these standard industry indicators, many in commercial real estate also rely on monthly economic indicators in employment to guide them. While the relationship is stronger in some cities than others, there has been a historical positive relationship between office-using employment growth and net absorption in the future.
But this relationship has been dealt a blow during this period of work-from-anywhere as the addition of one new office-using job won’t always translate into a need for more office space. Additionally, in order to adapt to the post-COVID era, employers have adopted a swath of new workplace models so this shift may continue for the foreseeable future.
The latest employment figures for Chicago are from May 2021, and Chicago’s office employment was still 4% off the peak levels it saw in February 2020 before the pandemic. The glimmering ray of light is the fact that its office-using employment didn’t fall as hard as other Gateway office markets and its recovery has fared better as well.
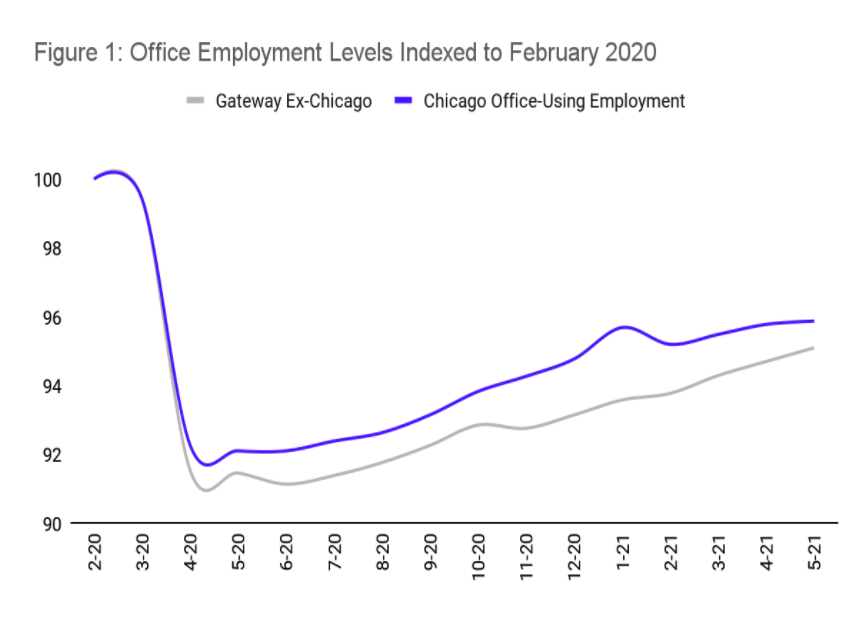
By labor market sentiment and statistics, Chicago’s office-using employment has been on a slow and steady recovery since June of 2020, which would imply that its office market would have already been on the mend. However, as mentioned earlier, the standard industry indicators give the narrative of an office market where demand is still hemorrhaging.
Where Chicago office demand sits today, according to VTS Data, the industry's real-time dataset
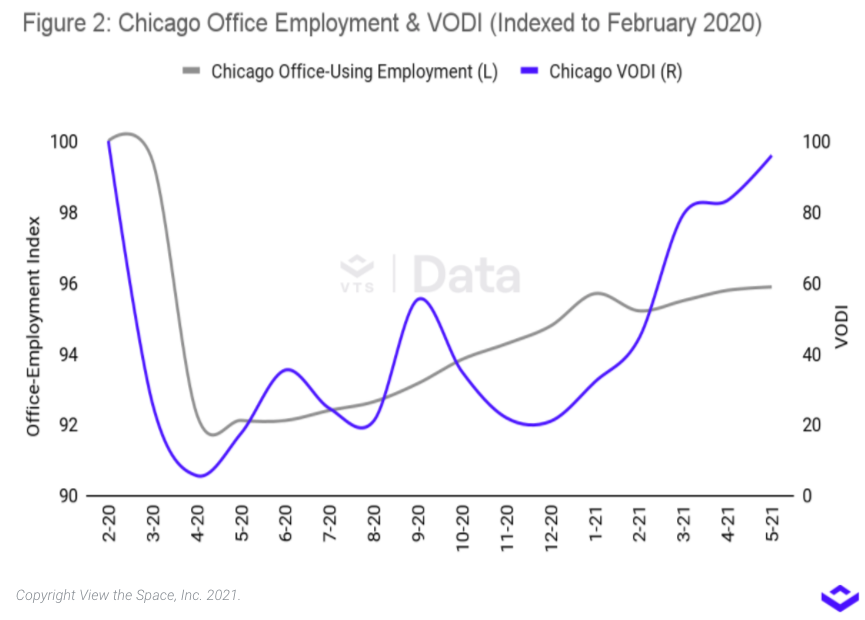
Commercial real estate has changed profoundly over the last year, with industry professionals trying to navigate market conditions never experienced before. In a time when the existence of the office has been called into question — despite the positive support from many companies’ return to the office — VTS Data and our proprietary VTS Office Demand Index (VODI) circumnavigates the noise in the market to provide the real-time pulse on office demand.
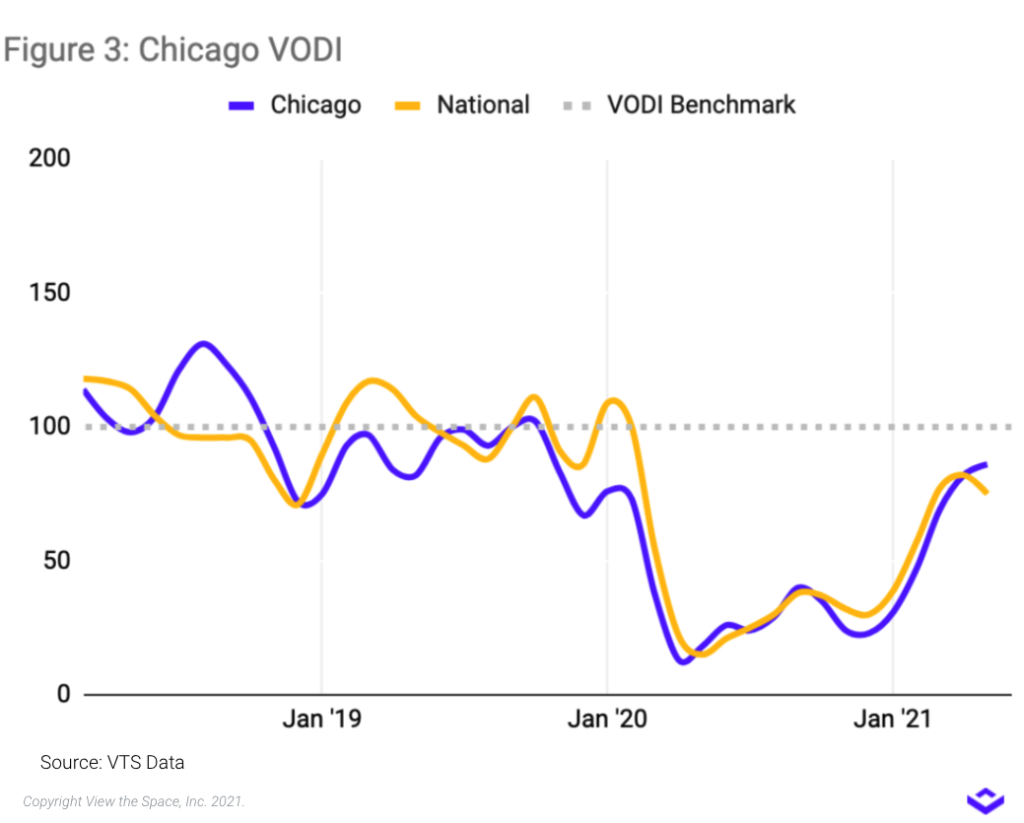
In Chicago’s case, the VODI fell from 73 to 13 or 82% between February 2020 to its trough in April. The index remained largely flat throughout the remainder of 2020 bouncing between 20 and 40 as economic uncertainty and working-from-home surrounded the sector. Although as vaccine rollouts improved and the election went into the rearview, the VODI nearly tripled between January to May. This swift change in momentum has translated into Chicago being the only gateway market to see more new demand in May than it did in early 2020 before the pandemic hit. This is not only positive news for the sector but for the metro economy overall as this signals business confidence and more job growth in a city that’s re-emerging from the upheaval of the last year and a half.
The takeaway
Demand for office space in Chicago is revitalized, despite what the traditional indicators may be reporting, which is good news for the market. However, the long-term prospects for the office are still clouded with uncertainty. It's a fact today that quantifying and building conviction around the investment thesis for the acquisition/development, financing, or management of an office asset is more difficult now than it was pre-COVID. Real-time data and insights paired with a focused, repeatable, asset-by-asset strategy, are of paramount importance in this environment.
Want more? The VTS Office Demand Index is just a sliver of the insights available in VTS Data. In fact, VTS Data is the industry's only forward-looking market data powered by the $200B in leasing transactions managed on the VTS platform. Our latest infographic — From Positioning to Pricing: Repositioning a Vacancy — shows just one of the many ways you can put this market data to work. You can also learn more about the full VTS Data offering, and get the latest commercial real estate market trends, on our all-new resource page.