Q4 | 2022
VTS Green Shoots Report
Premier space in NYC commands a 95% rent premium

VTS Green Shoots Report
Click through the map below to see which markets are trending upward (or downward) and how they stack against each other
Discover recent trends around tenant demand and VODI data, quarter over quarter. Click through the map below to see which markets are trending upward (or downward) and how they stack against each other.
VTS Green Shoots Report
Key trends over Q4

Flight to Quality (FtQ) shows two paths forward
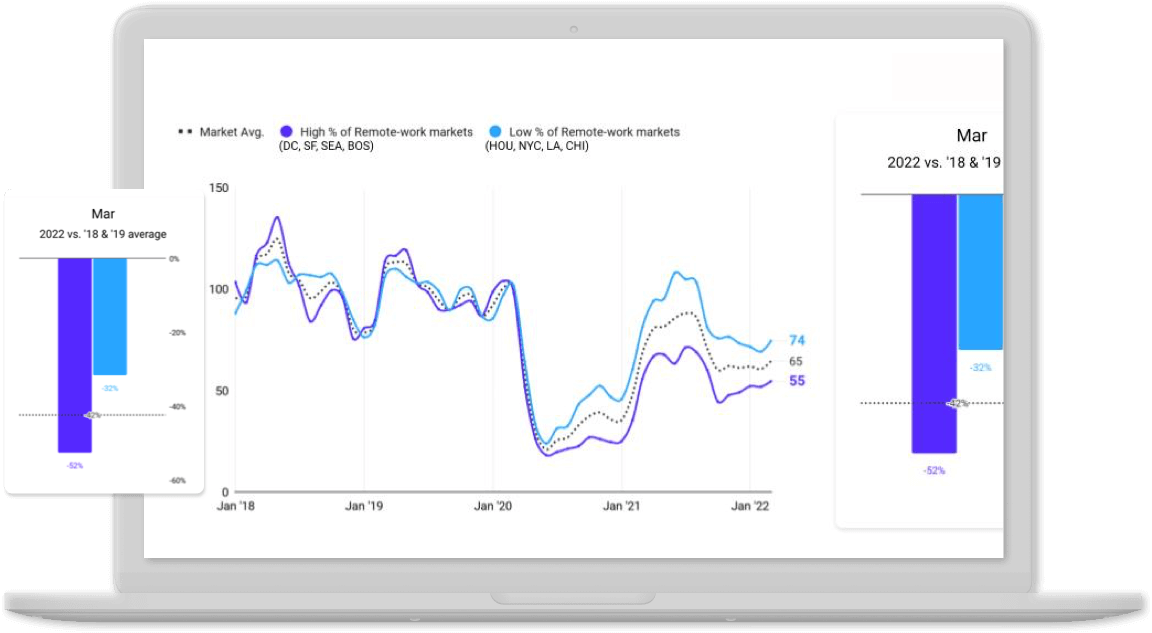
The dispersion of rents across varying asset quality is starting to take different paths from market-to-market. Some are reverting to the mean, while others are extending the premiums on the flight-to-quality.

Large tenant demand stabilizes
The declining count of large (50K+ sf) tenant requirements entering the office market may be bottoming out, down only 3% in Q4 ‘22 vs Q3 ‘22. On the other hand, small (<10k sf) and mid-size (10-50k sf) tenants entering the market were down -16% QoQ albeit on a higher base and are still closer to pre-COVID levels compared to large tenant demand.

Rate hikes set stage for debt opportunities & recaps in 2023
The Federal Reserve has increased the Federal Funds Rate as planned seven times in 2022. The last two rate hikes of +75 bps on 11/2 and +50 bps on 12/14 lifted the Fed Funds Rate to 4.25-4.50% at year-end, up from only 0.25% at the start of 2022.

WALTs by Submarket: Stability vs Downward Pressure
Trophy and Class A products in a submarket like Hollywood/Mid-Wilshire (Los Angeles) have a WALT of 6.3 years, while Class B and C offices in submarkets like the West Loop (Houston) and Financial District (San Francisco) currently have a WALT of only 2.6 years remaining.
Access the latest CRE market trends with VTS Data
Gain your competitive edge with the numbers that matter.