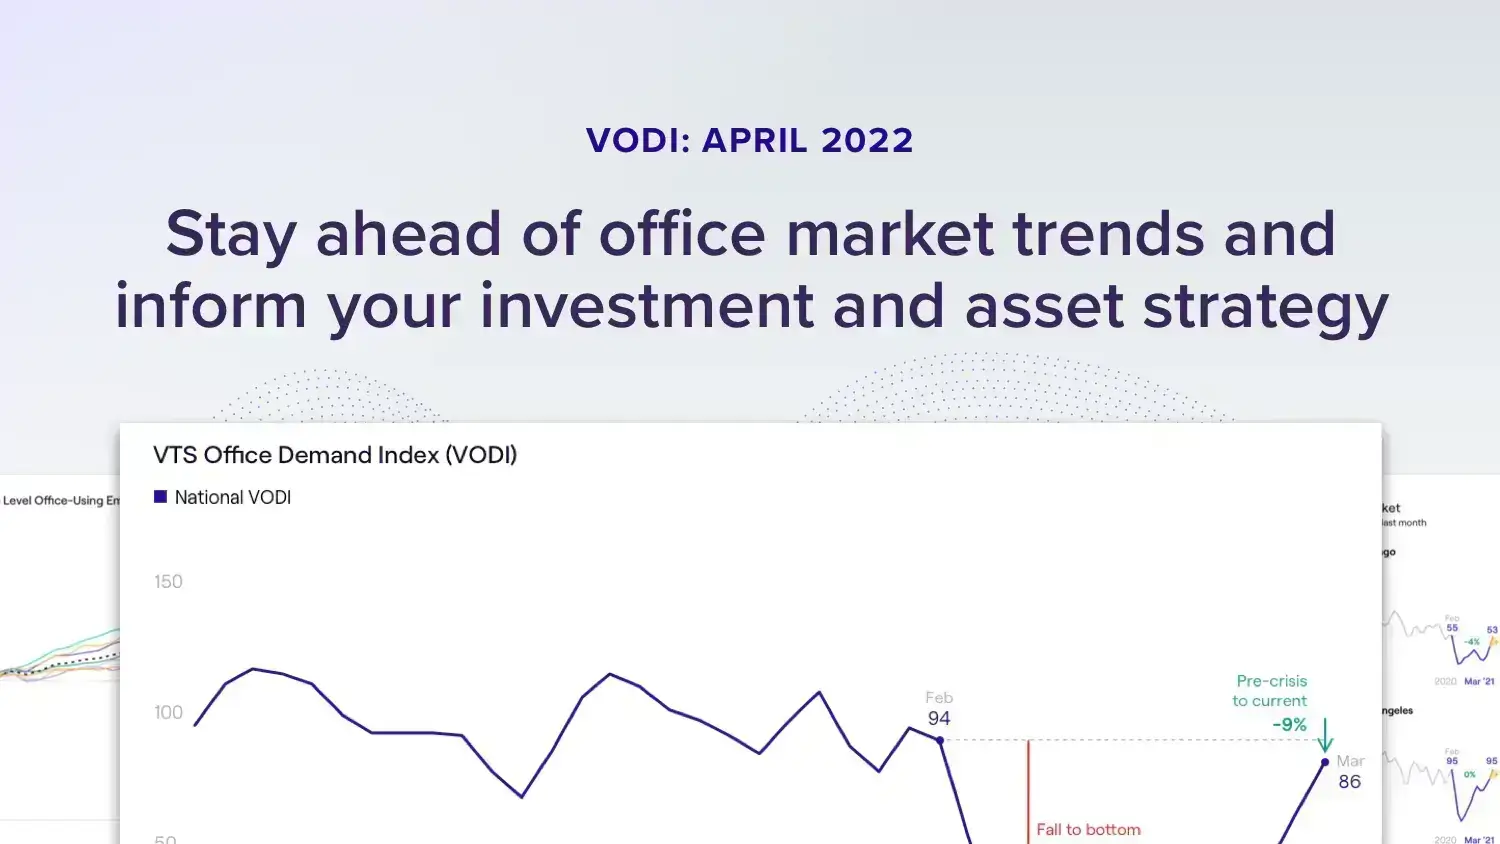
New demand for office space surged in March, up 20 percent from February and 8.2 percent year-over-year, according to the latest VTS Office Demand Index (VODI). This comes after five months of stagnation in the VTS Office Demand Index due to compounding COVID-19 variants and remote work.
Despite underperforming relative to the seasonal norm in February, demand for office space is now two-thirds of its pre-pandemic average, up from just half one month ago. March 2022’s growth in demand likely indicates that concerns about the COVID-19 omicron surge eased enough for prospective tenants to tour office space closer to their typical seasonal pace.
What is the VTS Office Demand Index (VODI)?
The VODI is the earliest available indicator of forthcoming office real estate trends, locally and nationally, and represents up to 99% of new demand for office space in seven major markets, including New York City, Washington DC, Los Angeles, Chicago, Boston, Seattle, and San Francisco. The VODI tracks tenant tours, both in-person and virtual, of office properties across the nation, and is the only commercial real estate index to track tenant demand.
The VTS Office Demand Index is powered by proprietary VTS Data, composed of aggregated and anonymized commercial real estate data from the 12B+ square feet of assets managed on the VTS platform.
Get today’s commercial real estate market trends in the latest VODI report:
- Learn which core market was the only market to see a decline in office demand in March.
- Nearly all major VODI markets saw a rise in office demand; learn which market made a notable recovery in March and why.
- How the Omicron surge for COVID-19 impacted the seasonal norm seen in previous years, and what 2022 has looked like in comparison.
Download the full VTS Office Demand Index April 2022 report now for in-depth insights into demand recovery and detailed methodology.
Want to learn how to use the data in the VODI? The VTS Office Demand Index is just a sliver of the insights available to you. VTS Data is your competitive edge in today’s market. Learn how to reinvent your investment strategy using active anonymized data from the $200B in leasing transactions. Benchmark your performance against the market and stay competitive in an ever-changing industry. Using data only available on VTS, resolve questions about supply and demand, leasing efficiency, and tenant exposure to unlock – and unblock – deals. Learn more about VTS Data here.
You can read our official announcement here.